As the new year begins, many consumers embrace Dry January—a month-long challenge to abstain from alcohol. Originally popularized as a personal wellness goal, Dry January has gained substantial traction over recent years, with more consumers opting for a healthier start to the year. To explore the reasons behind this growing consumer trend, Numerator surveyed 450 households that recently purchased Beer, Wine, Ready-to-Drink Cocktails, or Spirits. The survey delved into the motivations behind Dry January participation, how it influences shopping behavior, and whether it leads to long-term lifestyle changes—particularly in light of heightened health concerns and ongoing discussions around stricter alcohol warning labels.
How has Dry January Participation Evolved?
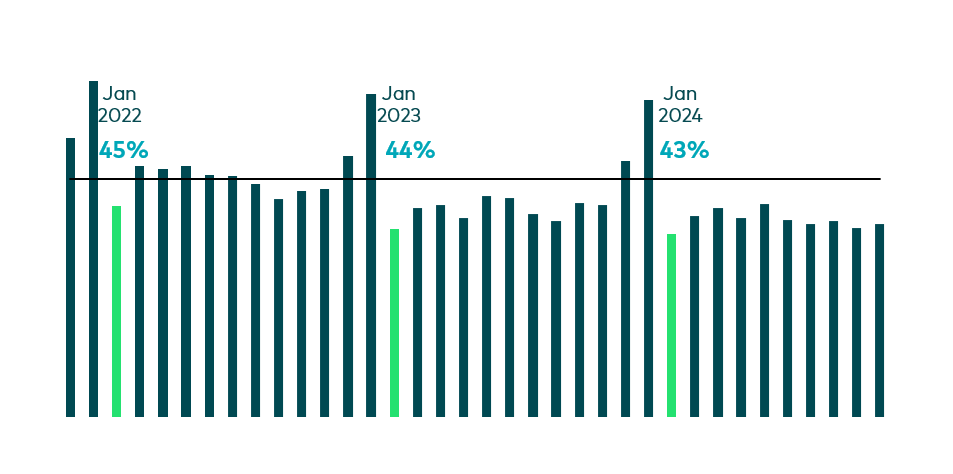
Over the past three years, Alcohol Beverages’ share of total Beverage sales experienced a large spike during the holiday months of November and December, followed by a drastic drop in January. The share of Alcohol Beverages within total Beverage sales has declined by a percentage point each January—from 45% in January 2022 to 44% in January 2023, and 43% in January 2024. This drop stands out compared to the three-year average share of 47% and is accompanied by a slower rebound in subsequent months, suggesting that some consumers are making sustained lifestyle changes. As for 2025, participation in Dry January appears poised to grow, with one in three Alcohol Beverage buyers planning to participate and one in four considering it. Seventy percent of consumers planning to participate have attempted Dry January in previous years, and of those, 75% report being mostly or completely successful in their efforts.

Who Participates in Dry January?
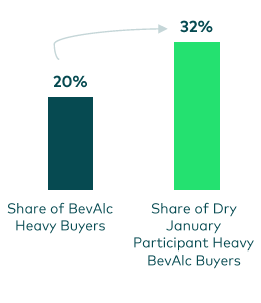
Dry January participants stand out from general Alcohol buyers in a few key ways. Overall, participants tend to have a higher likelihood of being Gen X, white, and part of a larger household with children. Interestingly, they are also more likely to be heavy Alcohol Beverage buyers compared to the overall market—60% more likely. In the broader Alcohol Beverage market, heavy buyers represent 20% of the total consumer base, while Dry January participants who are heavy Alcohol Beverage buyers account for 32%. This suggests that consumers with higher alcohol consumption, compared to those with lower or moderate intake, are increasingly opting to participate in Dry January. The major drivers for their participation tend to be health-related, with 41% of participants aiming to kick off the year on a healthier note, 23% seeking a personal challenge, and 21% curious about potential mental and physical health benefits. Many participants also plan to make lasting changes: one in three intend to reduce their alcohol consumption after January, and nearly half are undecided about whether they’ll return to their habits.

Are there Opportunities for Other Beverage Categories?
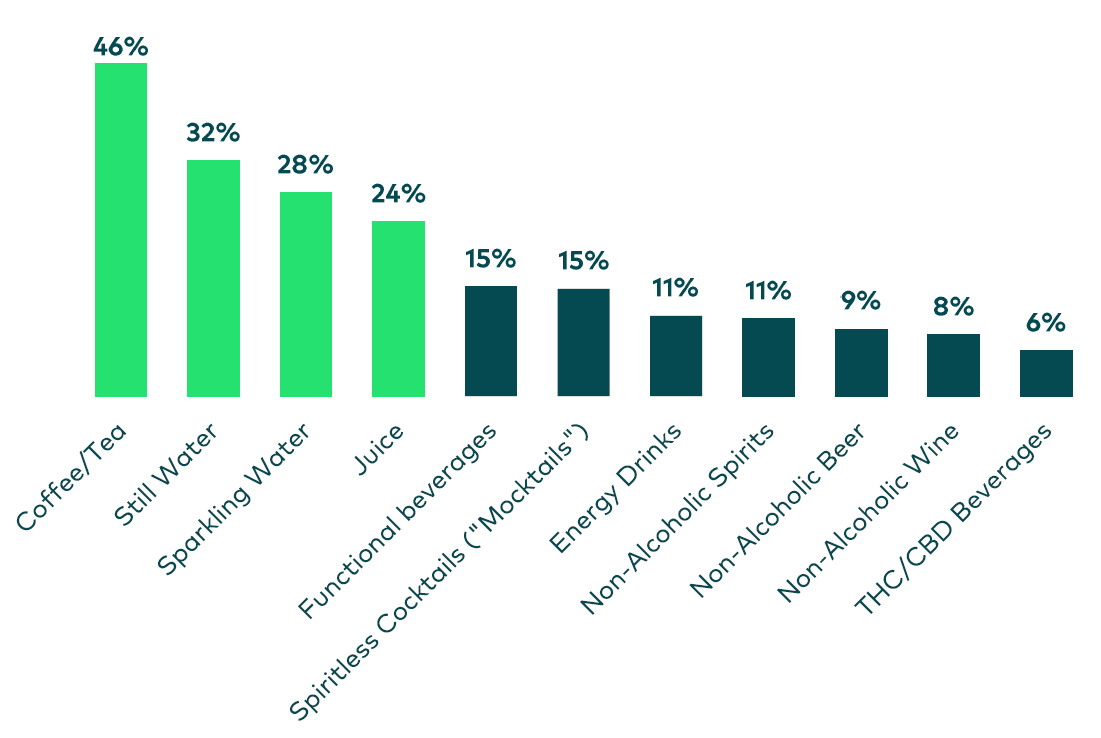
Dry January presents a valuable opportunity for functional beverages to thrive, as shopping behavior shifts and many participants seek alternatives to alcohol during this month. Over a third of survey respondents plan to continue their current lifestyle, but just cut out alcohol. While routines remain the same, consumers will still need something to drink. They often turn to Beverage categories like Coffee and Tea (46%), Still Water (32%), Sparkling Water (28%), and Juice (24%). These categories consistently see a boost in their share of total beverage sales in January, as consumers opt for healthier, non-alcoholic beverages. This shift offers a unique opportunity for brands in these segments to meet the growing consumer trends for products that align with wellness-focused resolutions. Beverages with functional benefits or better-for-you ingredients are especially appealing to consumers. By connecting with Dry January participants, brands can meet consumer demand beyond the challenge and support long-term health and wellness goals, leading to consistent shopper loyalty.

Generational Divides: Are There Additional Lifestyle Changes?
While more than a third of Dry January participants plan to make no lifestyle changes beyond cutting out alcohol, 20% intend to reduce or adjust their social activities. However, there are significant generational differences in how each group approaches the month. Gen Z, for example, is three times more likely to increase their consumption of THC and tobacco products and twice as likely to change their social routines. Millennials are also more inclined to turn to alternatives, with a 30% higher likelihood of increasing tobacco consumption and a 20% higher likelihood of exploring THC products or adjusting their social habits. In contrast, Gen X participants are 20% more likely to scale back on social engagements, while Boomers are 36% more likely to maintain their usual lifestyle without significant changes during the month. These generational shifts and consumer trends highlight key opportunities and challenges for brands targeting different segments during Dry January. Understanding these variations can help brands develop strategies that resonate with each group’s unique shopping behaviors and preferences.
Conclusion
Understanding the consumer trends behind Dry January and its impact on shopping behavior is essential for brands looking to capitalize on this growing movement. By looking at consumer demographics, motivations that drive participation, and generational differences, brands can tailor their offerings to resonate with specific consumer segments, maximizing their impact during Dry January and beyond. Brands that align their products with the wellness-focused goals of Dry January participants will not only meet the current demand but also position themselves to anticipate long-term shifts in alcohol consumption habits, ensuring ongoing consumer loyalty beyond Dry January. Reach out for a custom analysis of your brands’ performance this month.

