*This article is over 5 years old. For more recent insights on furry friends, check out our 2025 Pet Trends article & report.
Cat person or dog person? It’s a question for the ages, fun for getting-to-know-you situations certainly, but in the multi-billion dollar pet industry, it’s also an important customer segmentation question. Who are these owners, and how does buying behavior change by pet type?
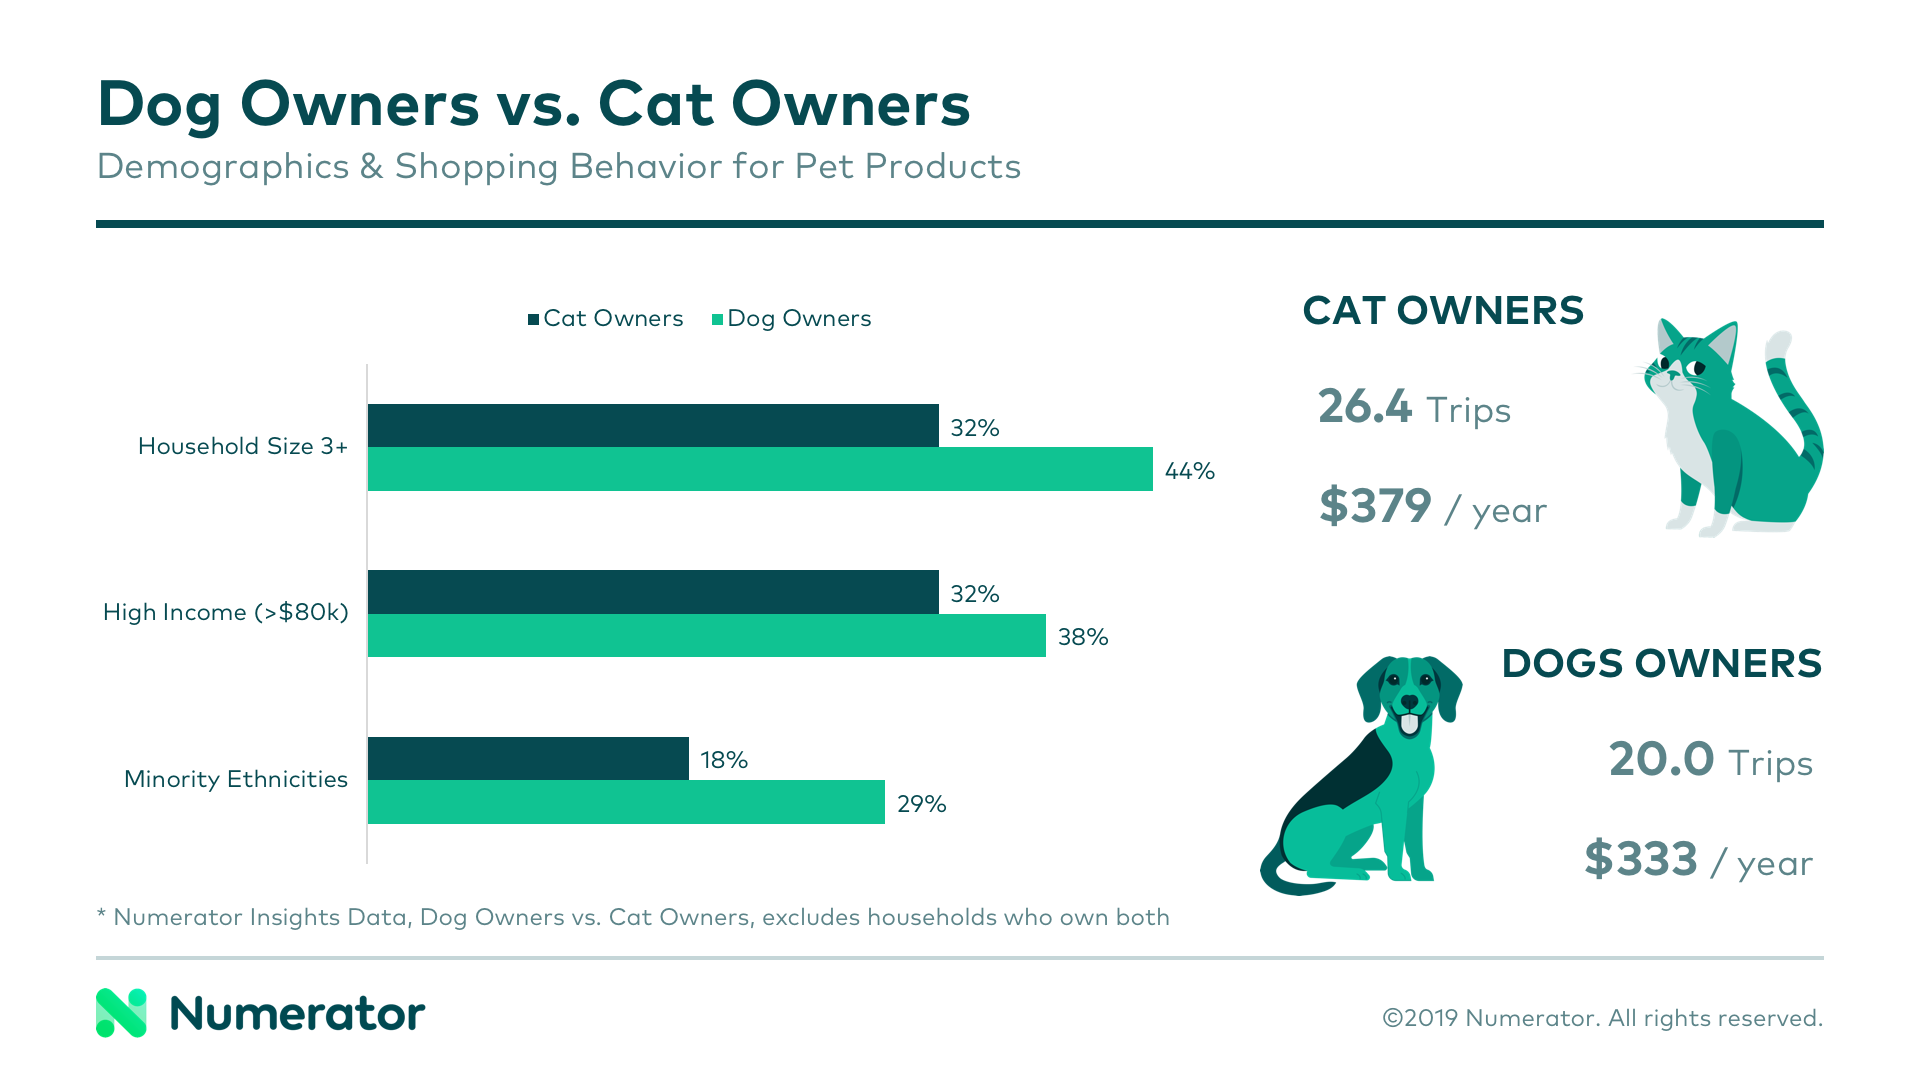
According to Numerator Insights data, 46.4% of US households are dog owners and 28.8% are cat owners. 16.6% of these households own both cats and dogs, but to get a better sense of dog vs. cat dichotomies, we compared only households that have one or the other. At a high level, dog-only households are typically larger (44% vs. 32% household size 3+), wealthier (38% vs. 32% high income), and more diverse (29% vs. 18% minorities) than cat-only households.

Despite having a generally lower income than dog owners, cat owners spend more in the pet category overall, driven by a higher purchase frequency and larger basket sizes. Breaking it down per pet owner segmentation, dog owners spend more of their pet dollars on food & treats (1.2x) and prescriptions (4.4x), while cat owners spend more on pet supplies (1.5x), primarily cat litter.
When shopping for their pets, cat owners are more likely to lump their pet purchases in with larger, 21+ item shopping trips, compared to dog owners, who tend to buy on smaller, 1-2 item trips. These pet owner consumer behaviors are also likely an effect of the stores shopped; while cat owners buy their pet supplies in the mass and food channels, dog owners are far more likely to make their purchases online, such as through Walmart grocery pick up, or in pet stores.
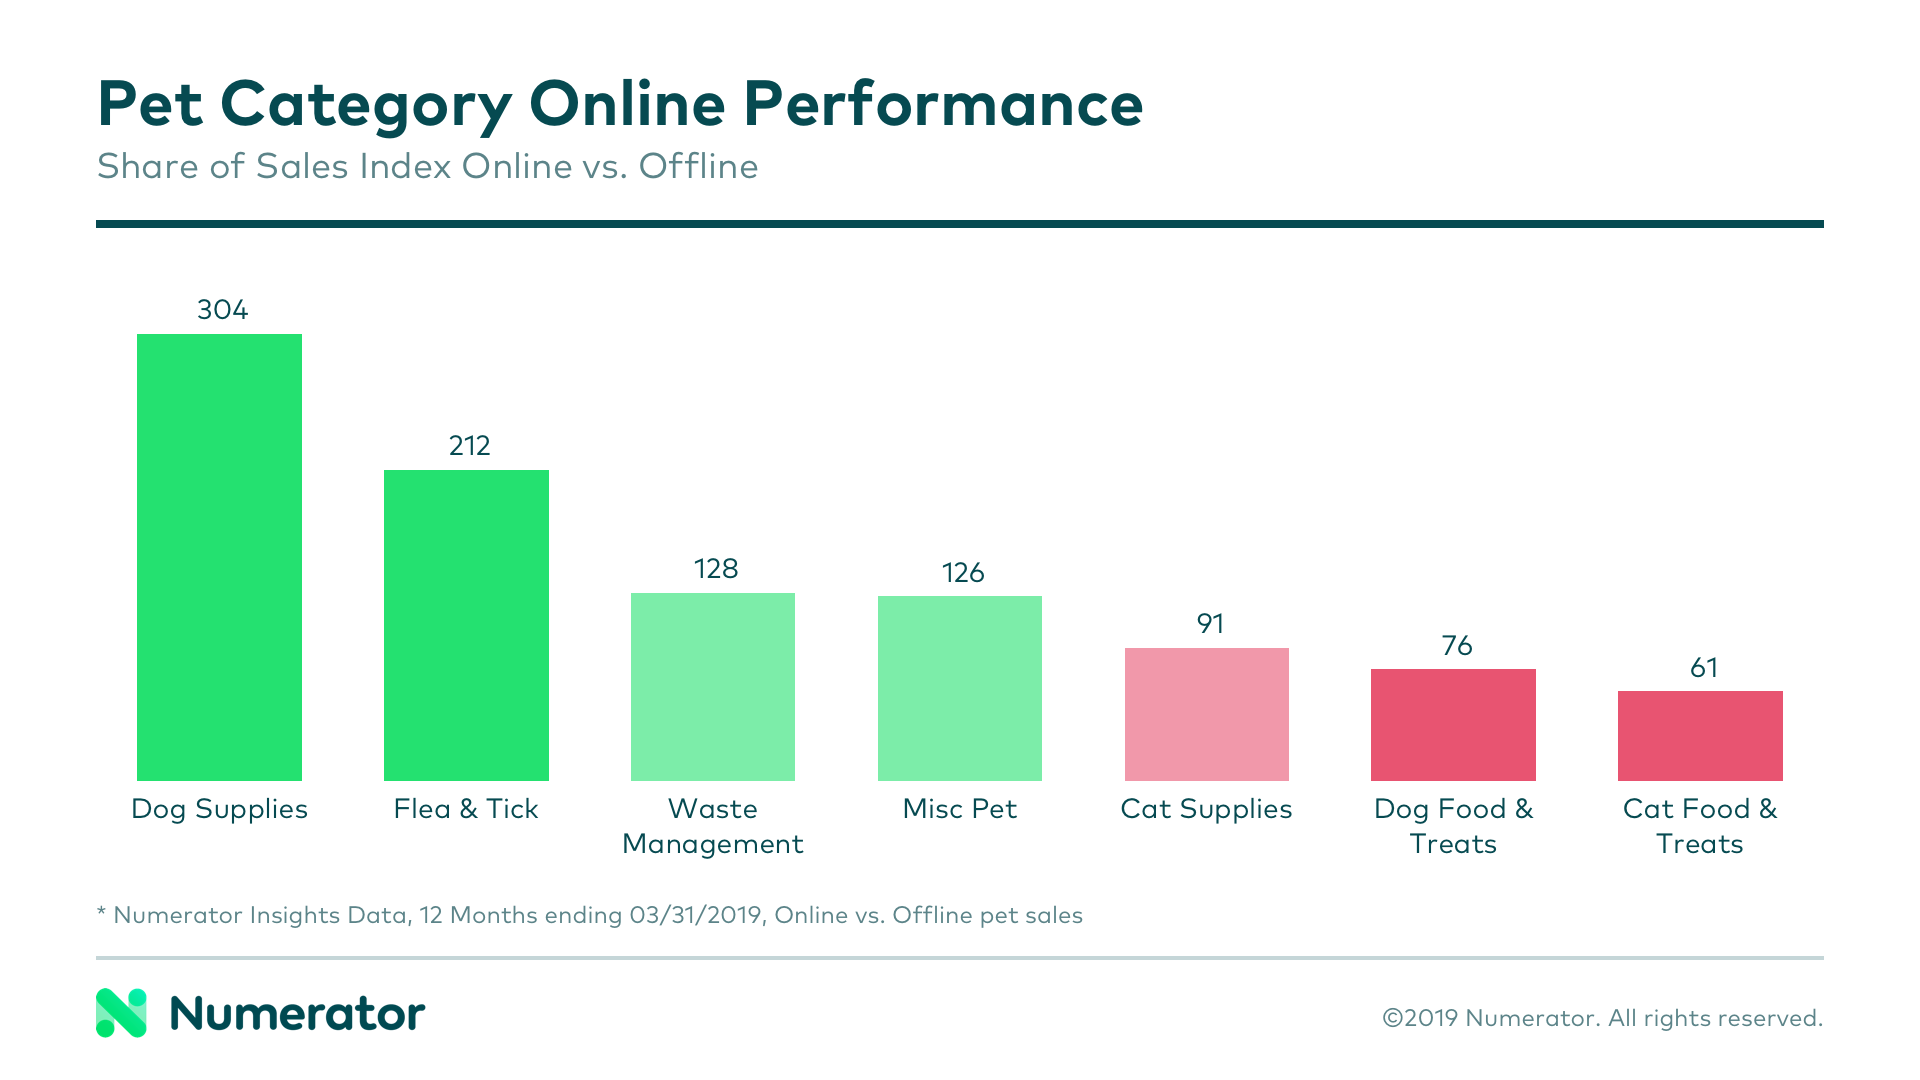
Given dog owners’ propensity for shopping online, it’s no surprise that our pet owner insights showcased that dog supplies are one of the best-performing pet categories on the web. Compared to brick-and-mortar pet sales, dog supplies make up a 3x larger share of overall pet sales online. Larger categories like dog food & treats, cat food & treats, and cat supplies make up the bulk of both on and offline sales, but compared to offline sales, these big hitters account for less of the total online. Smaller categories, on the other hand, performed significantly better online than offline.

Numerator Psychographics data shows that 21.4% of dog owners perceive private label quality as “excellent” compared to 19.6% of cat owners. This perception translated to their pet purchases; private label is the top brand for dog owners and second place for cat owners. Dog owners spend 10.9% of their pet dollars on private label, while cat owners spend only 7.7%. Other top brands for each group were Pedigree and Blue Buffalo for dog owners and Friskies and Arm & Hammer for cat owners.
Expanding beyond the lens of pet-purchasing behavior, we still see slight variations between dog and cat households, often tied to the life stage and living situations of each group. Numerator’s pet owner insights show while dog owners spend more of their budget on baby supplies, tools & home improvement and apparel, cat owners spend more on pet, books and entertainment.
A deeper understanding of the consumer can help to predict buying behavior and purchase drivers, and for roughly half of Americans, pets are an important member of the household. Contact us today to discuss how pet ownership may be impacting your category or our pet owner segmentation capabilities.

