As the seasons change, a significant portion of the population braces for the inevitable onset of seasonal allergies. This phenomenon has led to a robust market for over-the-counter (OTC) allergy medications, with nearly two-thirds of U.S. households purchasing these products according to Numerator data. In this analysis, we’ve reviewed purchase data and findings from a Numerator Instant Survey of 500 verified allergy medication buyers fielded during the 2024 spring allergy season to offer insight into allergy medication buyers, their seasonal purchasing patterns, and their sentiment towards OTC medication usage, private label quality, medication advertising and more.
The Average Allergy Shopper Snapshot
Who is the average buyer of OTC allergy medications?
According to Numerator purchase data, 64% of US households purchased allergy medications in the 12 months ending April 2024, spending an average of $58 and making 3-4 separate purchases. Among them, 60% purchased adult allergy meds while 15% purchased children’s allergy meds, highlighting significant overlap between the two.
The typical allergy medication buyer tends to be a married Gen X individual living in a rural area. Compared to the average consumer, these buyers are 9% more likely to be high-income ($125K+) and 12% more likely to live in the East South Central US census region. Additionally, they are likely to experience household allergies beyond just seasonal ones —they are 9% more likely to have or have someone in their household with a tree nut allergy and 6% more likely to have or have someone in their household with a wheat allergy.
Seasonal Shifts in Allergy Med Use
What are seasonal trends and consumption patterns in OTC allergy medications?
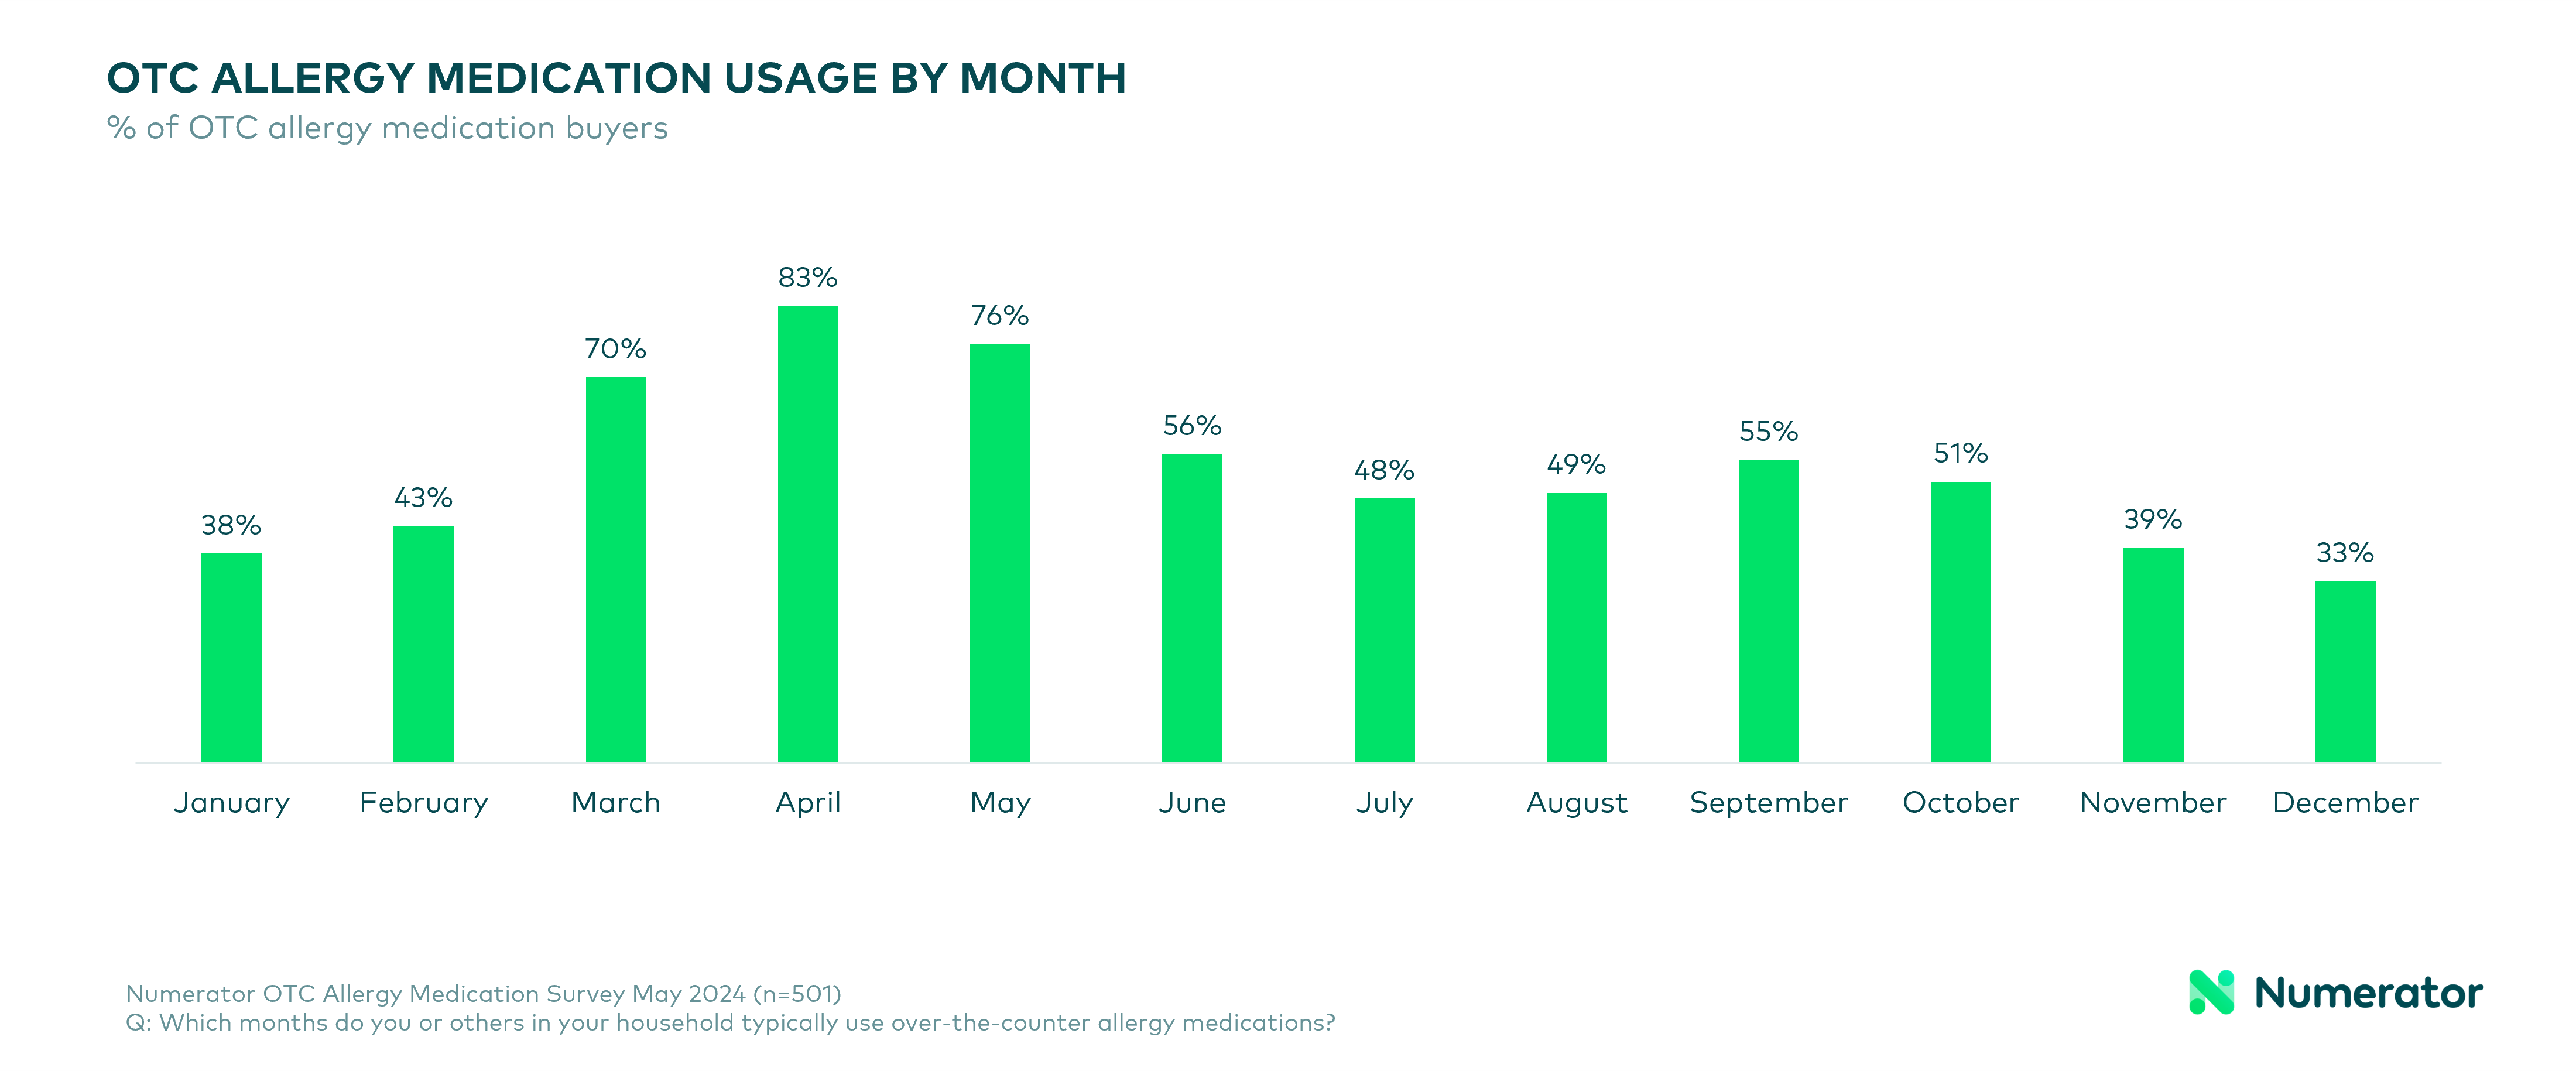
In our spring allergy survey, consumers reported that their allergy medication usage peaks in spring and fall, with the highest usage reported in April, May, and March. Unsurprisingly, then, April is historically the top month for allergy medication sales (11.3% of annual sales in 2023), followed by March (10.4%), May (10.3%) and September (8.6%). This seasonal pattern aligns with the overall prevalence of pollen and other allergens.
During high-allergy months, 60% of allergy medication buyers take these medications daily while only 5% reported taking them a few times per month, highlighting the chronic nature of seasonal allergies and the need for consistent symptom management. Nasal symptoms are the most frequently treated, with 84% of users addressing issues like itchy, runny, or congested noses. This is followed by itchy or watery eyes, which 65% of respondents treat with allergy medications.
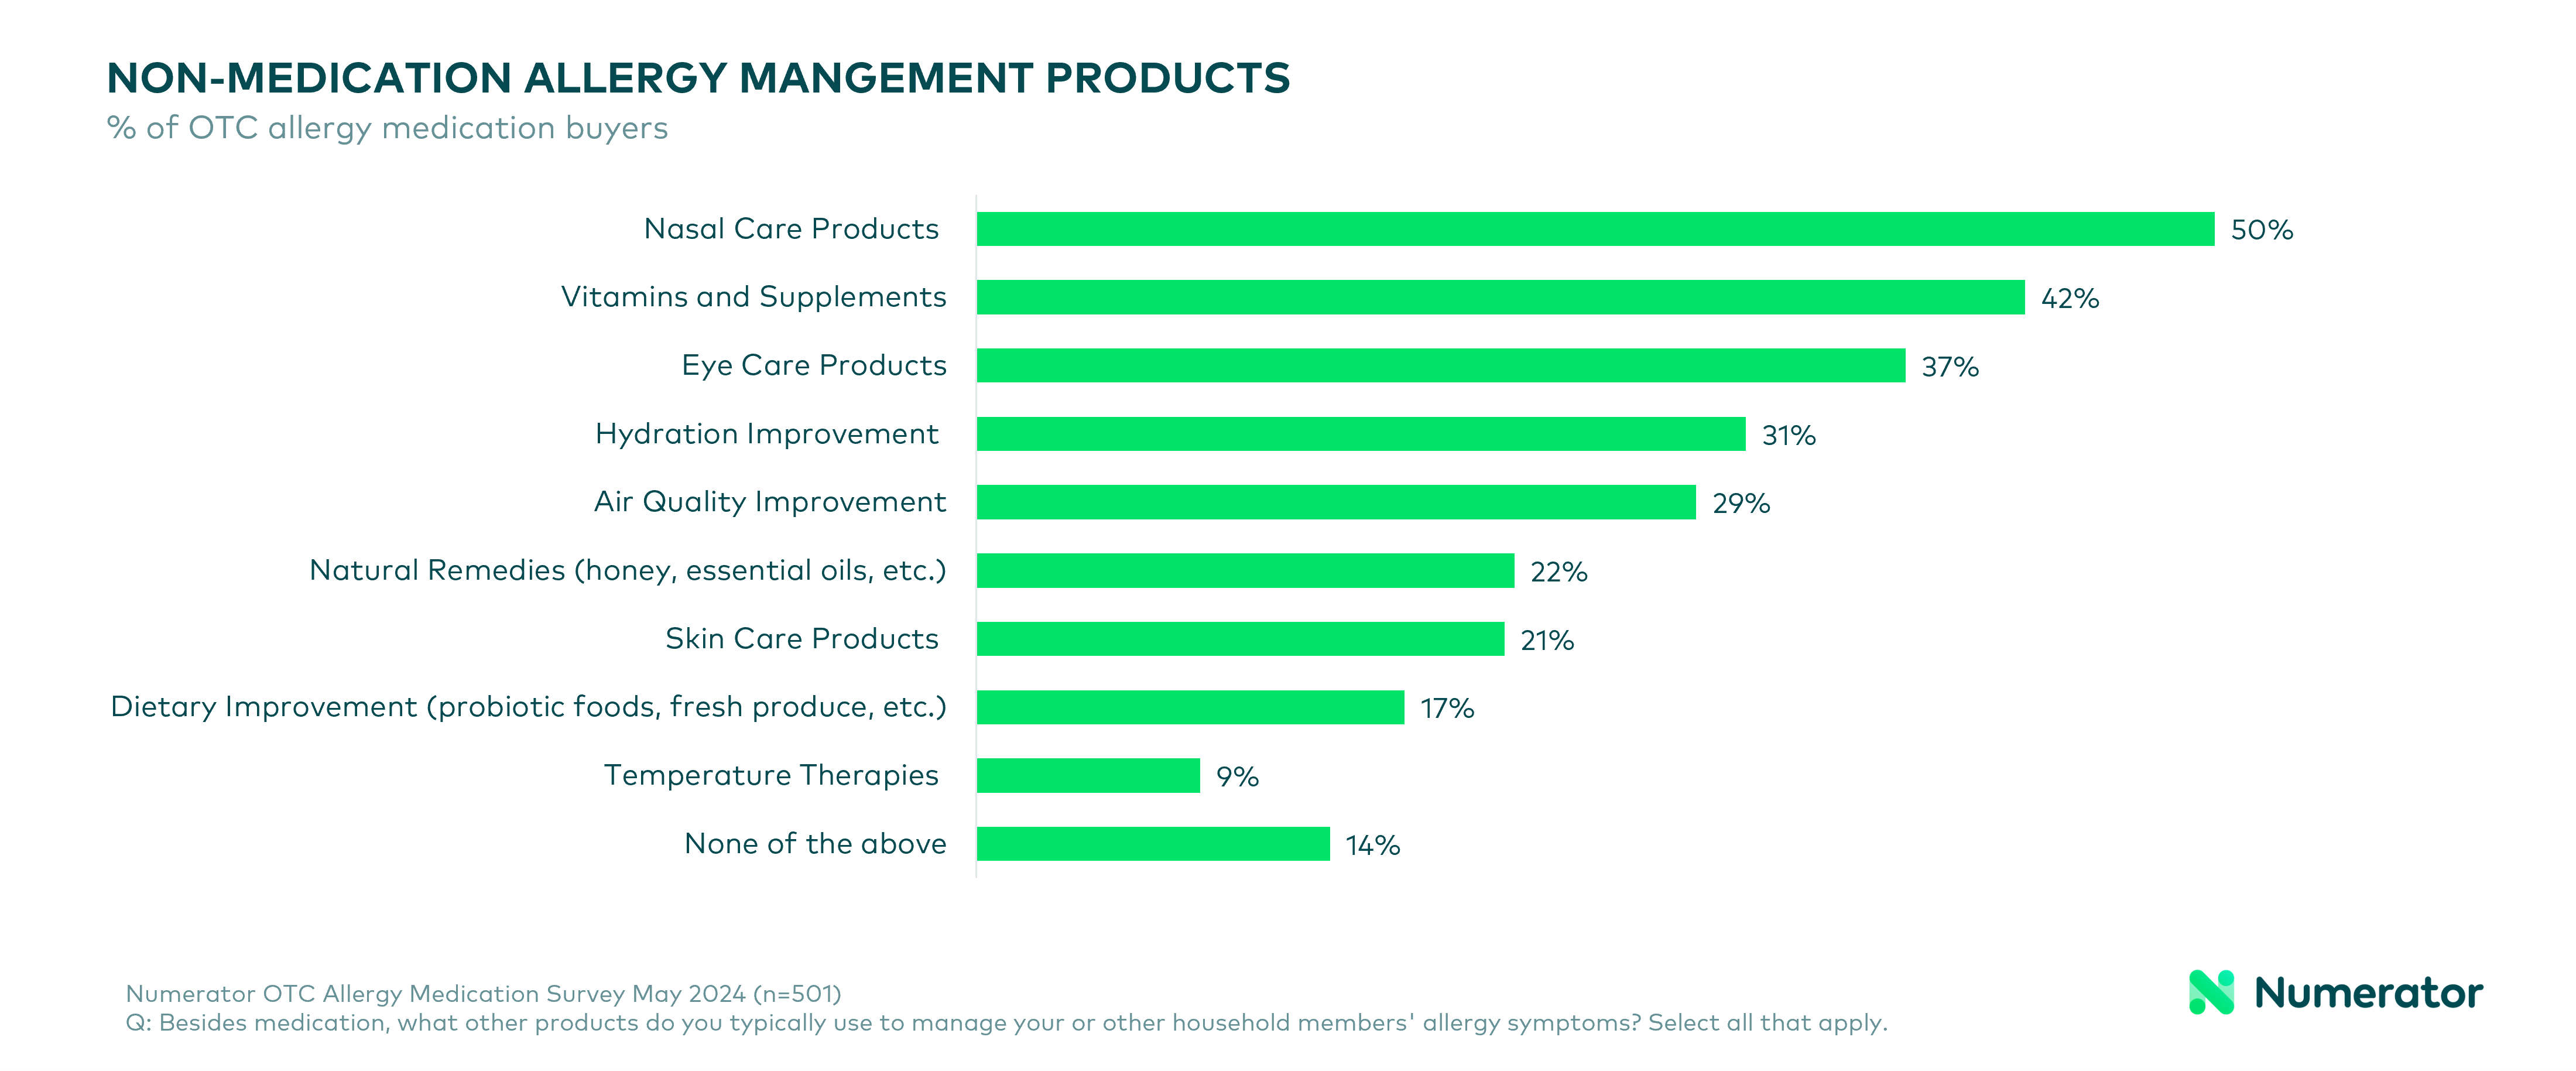
Interestingly, while 70% of consumers reported using only OTC medications, 30% indicated they supplement these with prescription options. Additionally, many consumers purchase supplementary products such as nasal care items, vitamins, and air quality improvement tools to alleviate their symptoms further. This indicates a comprehensive approach to managing allergy symptoms, where OTC medication is just one part of a broader strategy.
Brand Perceptions Among Allergy Shoppers
How do allergy medication buyers perceive brand quality and advertising?
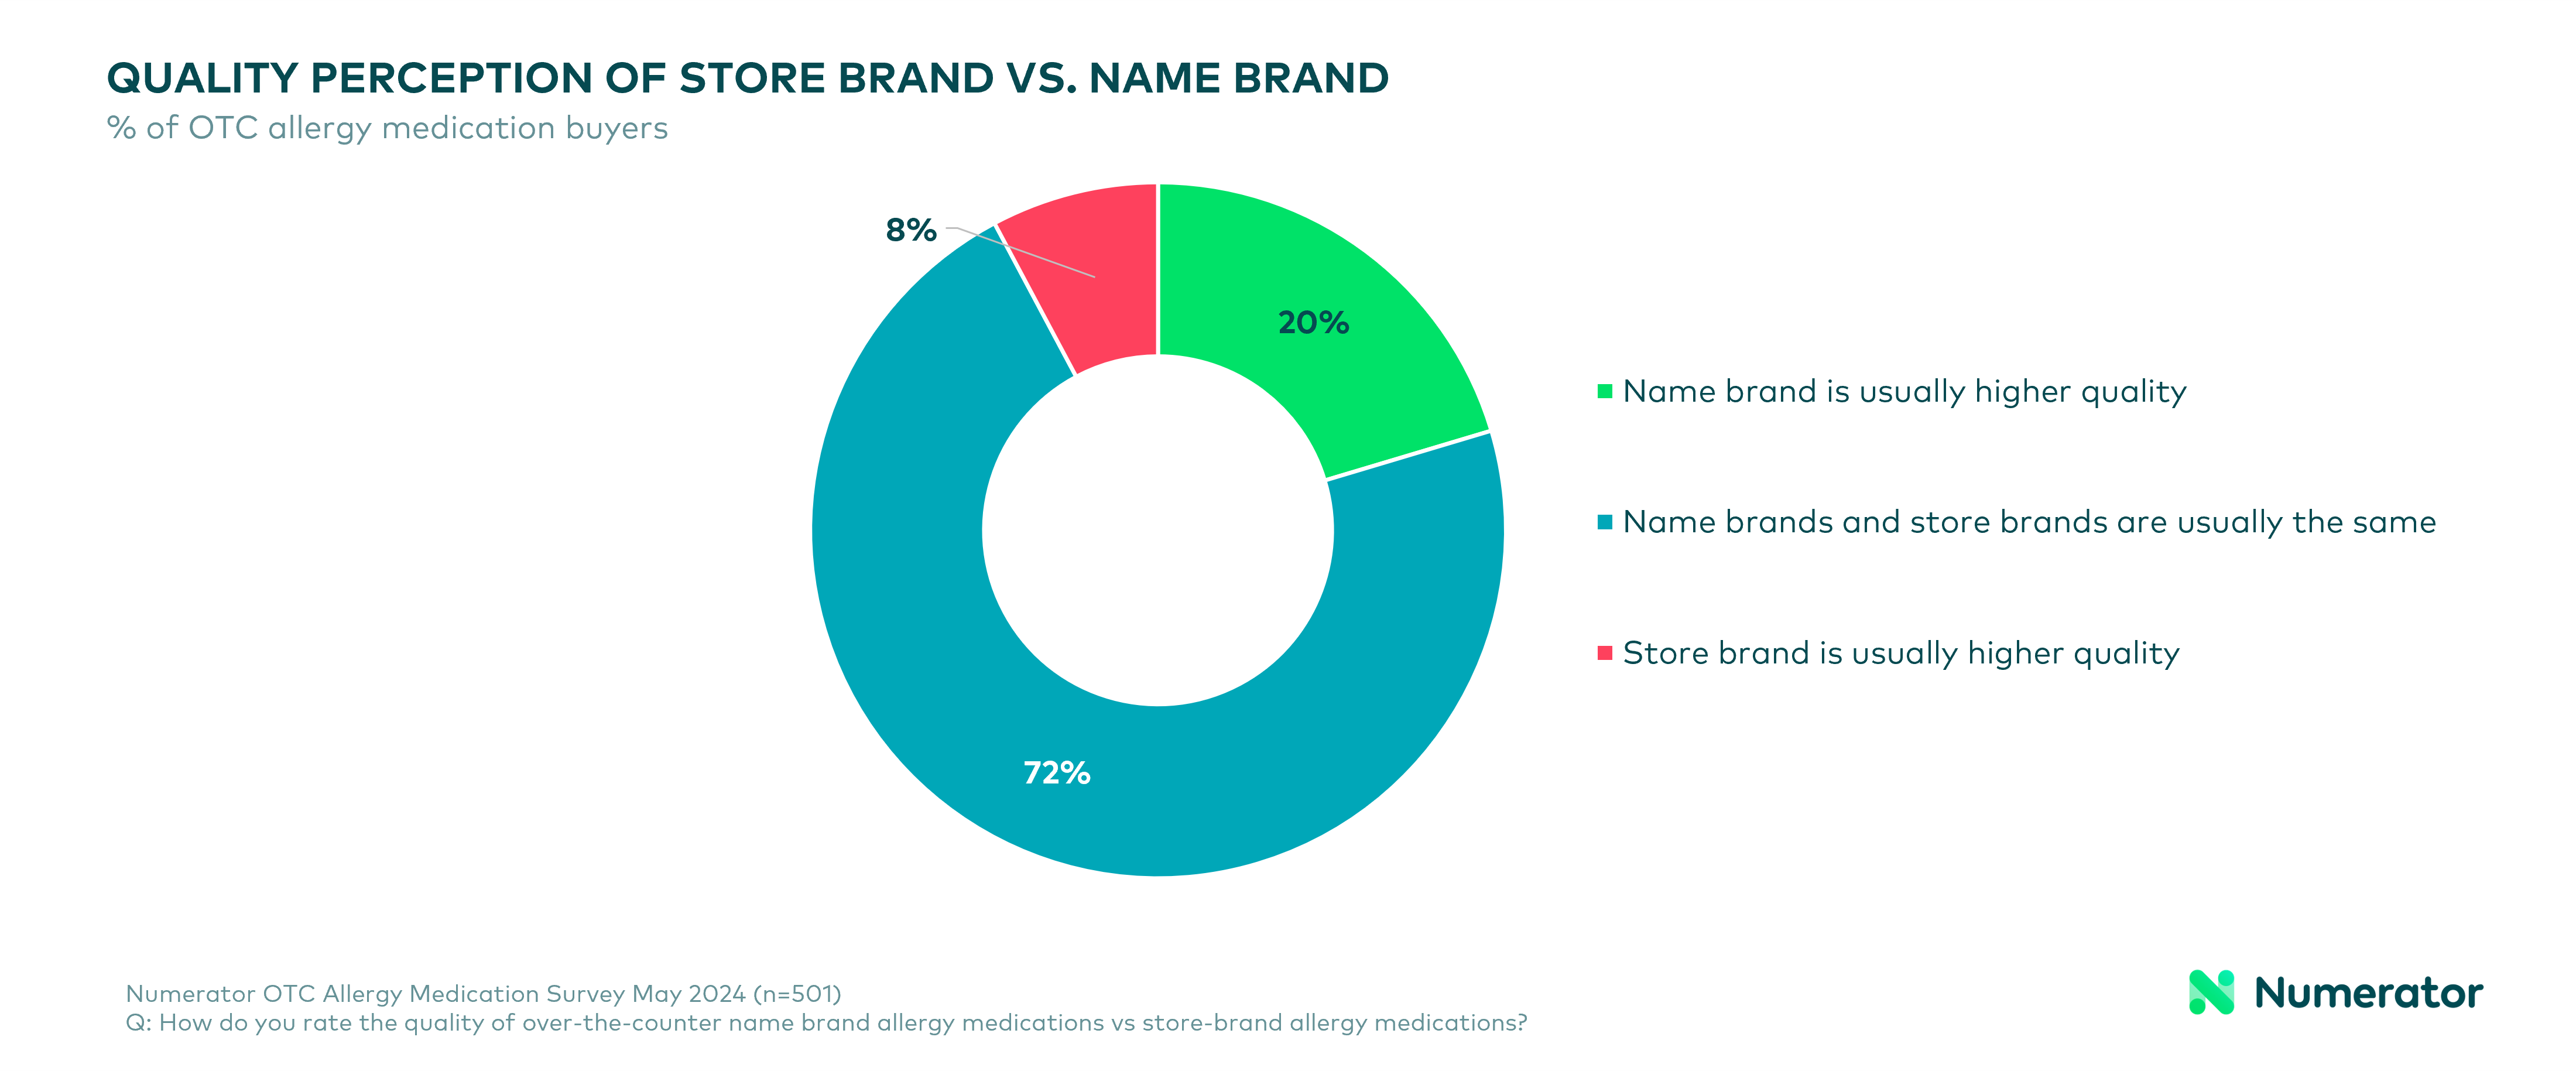
One of the most intriguing findings from the survey is the perception of quality between name-brand and store-brand medications. A significant 72% of consumers believe that store-brand and name-brand allergy medications offer the same quality. Despite this belief, purchasing decisions are evenly split: 38% prefer name-brand products, 36% opt for store brands, and 26% switch between both. This balance suggests a competitive market where brand loyalty is not as strong as it might be in other product categories.
Among the various brands, Zyrtec, Claritin, and Walmart’s Equate dominate the market, capturing the highest shares of consumer spending. Despite the plethora of options, advertising plays a limited role in influencing purchasing decisions. A notable 75% of buyers report that advertisements do not affect their choices, though 17% are more likely to consider a brand they have seen advertised. This data suggests that while advertising can sway a minority, the majority of consumers rely on other factors such as personal experience and product efficacy.
A Dose of Insights for the Future
How can health brands better understand their consumers?
The market for seasonal allergy medications is dynamic, with consumers displaying varied preferences and behaviors. Numerator Instant Surveys can help you connect quickly with consumers during peak allergy season, or any time of the year when you need fast answers to better understand the preferences and needs of your consumers. To learn more, contact your Numerator representative or reach out to us today.
–
Numerator’s OTC Allergy Med Survey was fielded 5/3/24–5/6/24 to 500 consumers


