The government shutdown may be over, but its effects are still lingering, especially for households who are reliant on the Supplemental Nutrition Assistance Program (SNAP). Due to inconsistencies in the benefit payment timeline caused by the shutdown, many SNAP recipients faced a large break of time between payment periods. Though a benefit payment was never officially missed, the shift in the payment timeline significantly impacted SNAP households, specifically when they shopped and how much they spent overall.
This January, in the midst of the 35 day government shutdown, a decision was made to issue all February SNAP benefits early, rather than risking a missed month of benefits should the shutdown last much longer. February benefit payments were made to most households around January 20, two or more weeks earlier than usual. As a result of the shifted timeline, 15 million low-income households were left to face a significant gap between benefit payments, some of more than 50 days, according to a report put together by the Center on Budget and Policy Priorities.
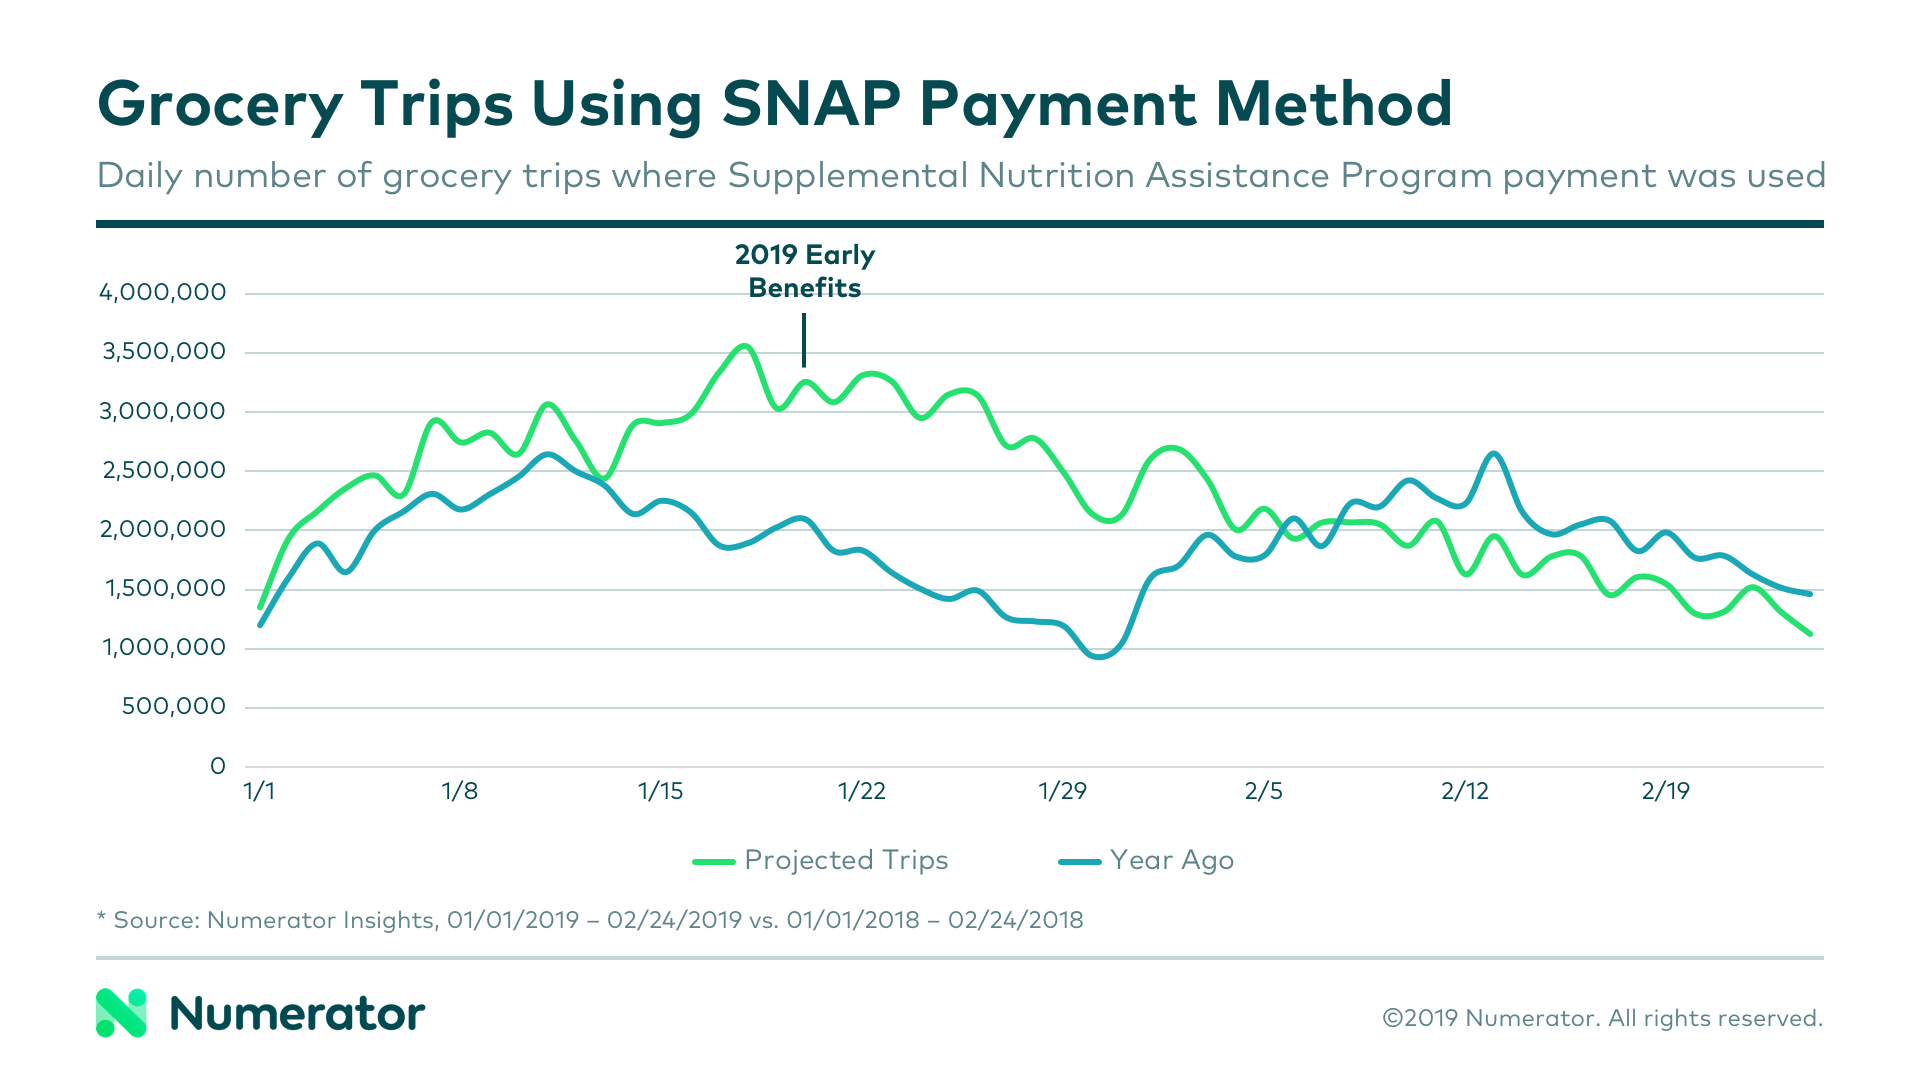
In a typical month, the majority of shopping trips funded by SNAP are seen early on when households first receive their benefits. As the month continues and benefits run out, the prevalence of SNAP as a payment method decreases. This year, SNAP trips surged at the end of January, when households received their early February benefits, and steadily declined thereafter, dropping below the 2018 rate in early February.

Not only did trip timing fluctuate, but SNAP households also had an overall decrease in grocery spend during the January-February time period compared to last year. Though their buy rate (the amount each household spent on groceries during the month) was up $10 (2.2%) in January, it plummeted in February, with households spending $40 less (-10.5%) on groceries versus one year ago.
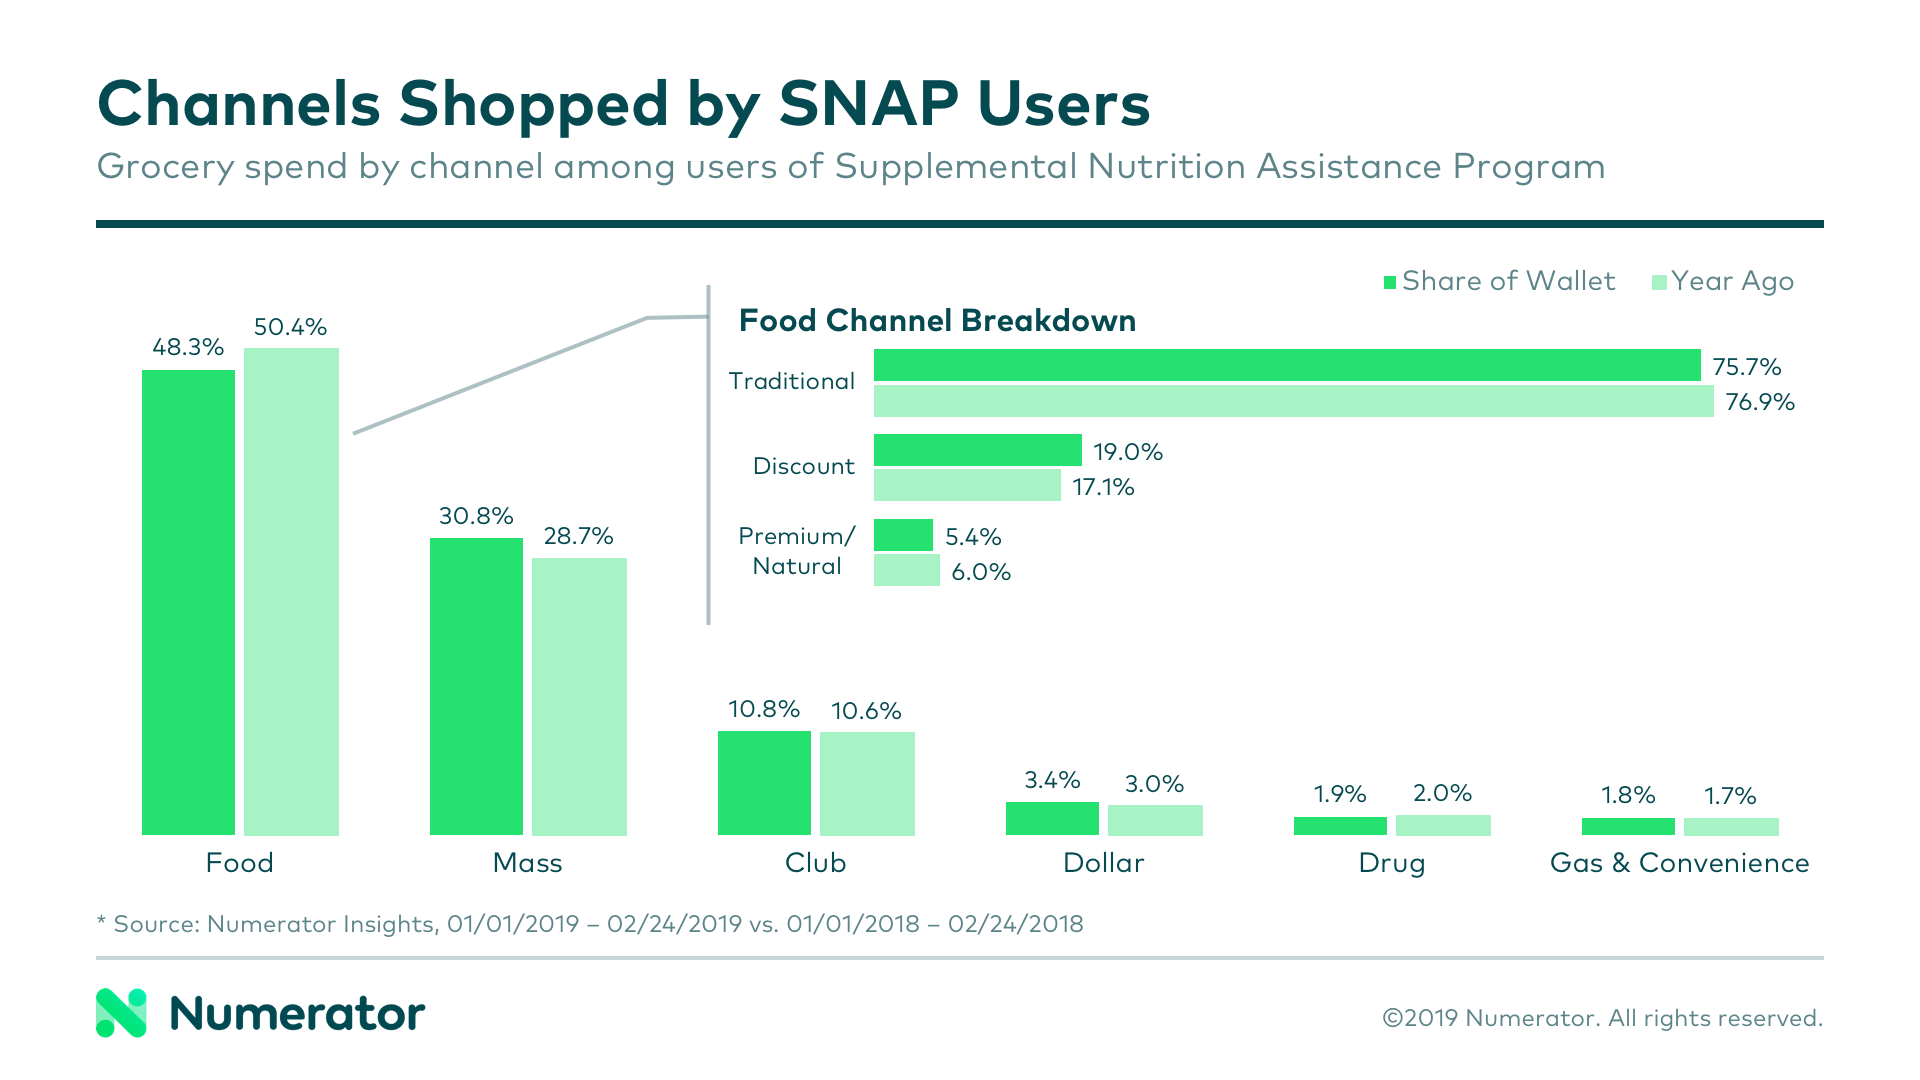
The food channel saw the most significant decline in share of wallet among SNAP households during this period, specifically at traditional and premium/natural grocery stores. Discount grocery, mass and dollar channels all experienced a slight increase in share of this group’s grocery dollars, likely a result of households trying to make the most of their limited funds.

According to psychographic data gathered through Numerator microsurveys, nearly 40% of SNAP households identify sticking to a budget as an important aspect of their shopping habits, compared to 33% of all shoppers. This group is also likely to classify themselves as “a ‘spender’ not a ‘saver’” (20%) and to feel “overwhelmed by [financial] burdens” (18%). When it comes to brands shopped, SNAP households look more favorably on private label than the average shopper, with 30% of SNAP households identifying private label value as “excellent” and 23% saying “price trumps brand names,” versus 25% and 22% of all shoppers.
Most states adjusted their March SNAP payments to help ease the financial burden caused by the original shift. Some opted to shift the payment up slightly, while others plan to release benefits in multiple waves to eliminate another extended gap. The ripple effect of this shift is predicted to last through March, potentially longer depending on steps taken to stagger payouts and stabilize spending.
Understanding the needs and preferences of SNAP beneficiaries will allow you to better serve your consumers in a time of financial difficulty, and anticipating program fluctuations can help you guard against significant hits to your bottom line. Which products and categories will be impacted most? Where will shoppers be shifting their spending, and how can you minimize leakage? What types of promotions would be most compelling and useful for SNAP shoppers?
To answer these questions and to learn more about how shifts in the SNAP payment schedule may be impacting your business, give us a shout and we’ll dig into the data with you.
(Note: The final week of February was not included in this analysis. Both 2019 and 2018 periods reference 01/01 through 02/24)

