*Note: These insights are from 2019. Read our 2021 Back to School blog to learn more about shopper intentions, or check out our 2021 Back-to-School Tracker for the latest insights into the shopping, advertising, and promotional activity.
—
Summer vacation is quickly coming to an end, and parents and kids everywhere are preparing to transition into the school year by going back-to-school shopping. There are some schools already in session, but many more are at least a few weeks away and retailers across the country are holding back-to-school sales throughout August and into September to entice those shoppers into their stores. To help you study up on this often-overlooked sale event we created the following lesson plan covering back-to-school shopper psychographics, as well as retailers’ promotional and advertising strategies during the back-to-school season.
As students and their parents prepare for the beginning of the school year, families are planning to spend more than ever this year on supplies ranging from glue and backpacks to calculators and computers. According to the National Retail Federation, shoppers with school age children are expected to spend an average of $700 on back to school supplies in 2019. To gain a better understanding of this shopping season, we reviewed Numerator’s 2018 Promotions Intel data, Ad Intel data and Psychographics data from mid-July through mid-September to see how retailers promoted and performed during the season last year. Who is the average back-to-school shopper? What motivates their purchasing behavior? Which categories and brands got promoted the most?
Back-to-School Shopper Psychographics
First let’s take a look at the average back-to-school (BTS) shopper in 2018. Over 22% of shoppers indicated that they participated in back to school shopping last year. This group is very exposed to marketing across the board, and they seem to be pretty observant about it. They consider TV and online advertisements to be the most influential forms of advertising, but social media and online mobile are the two methods they over-index the most (so they favor these methods more than the general population). They are also slightly more likely to be influenced by in-store advertising—a good thing, considering the prevalence of back-to-school displays.
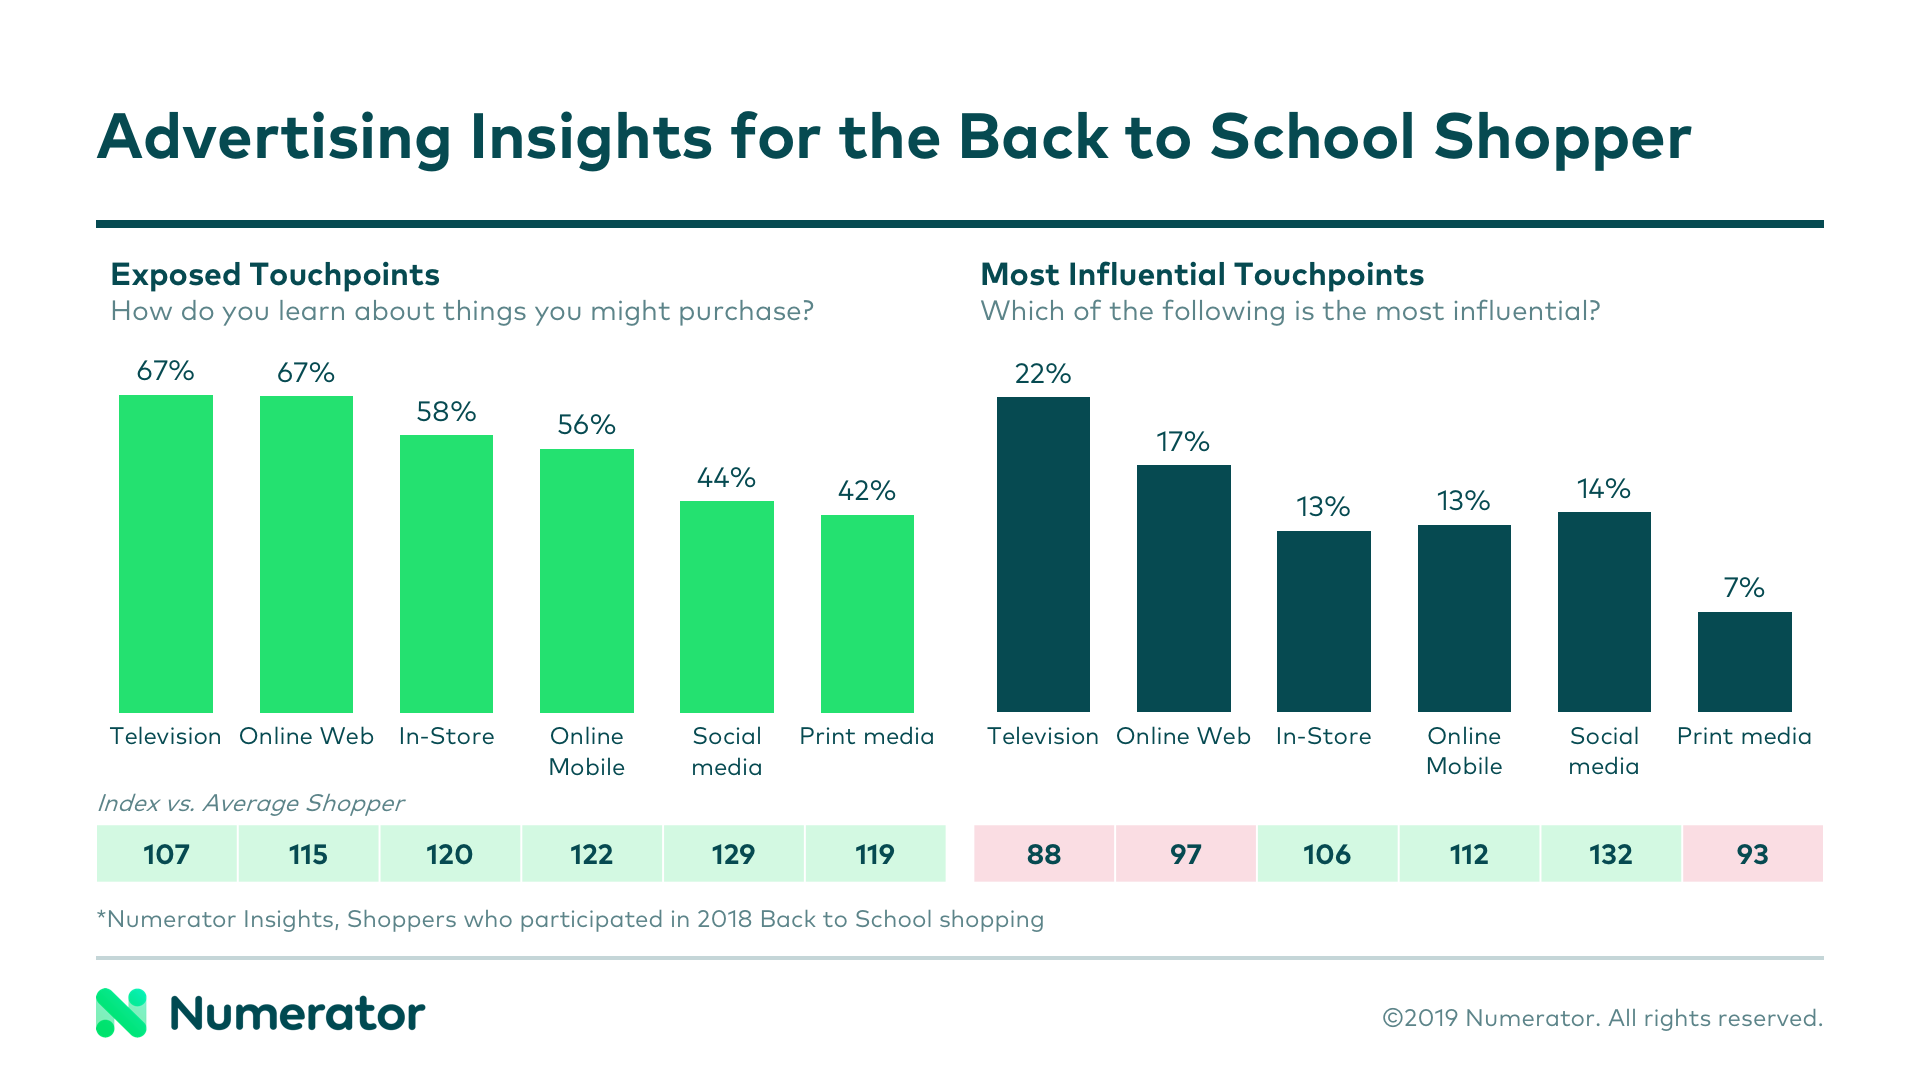
This group also shops online more frequently than the average shopper, usually because it saves time. They’re price driven and budget driven when they shop, and are more likely to make a list, clip coupons, and check ads than the average shopper. They’re also 1.3x more likely to browse in-store displays (goes along with their openness to in-store advertising).
Back-to-School Advertising & Promotions
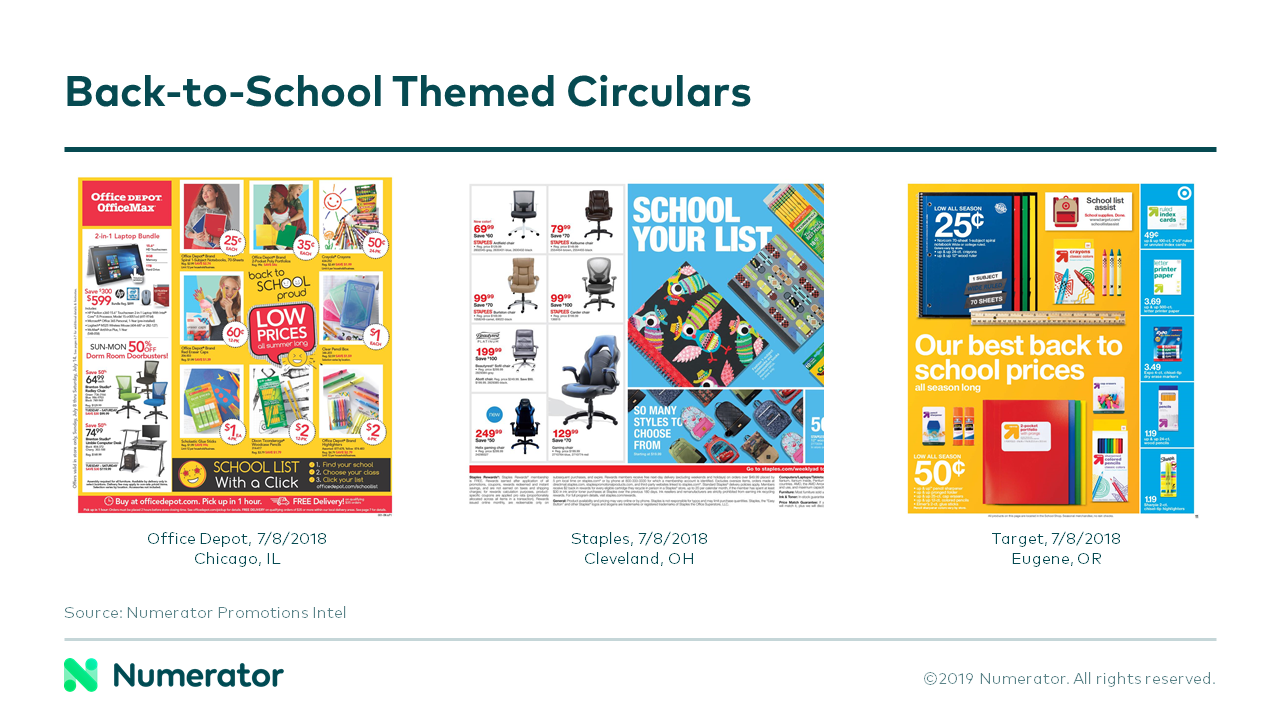
Retailers began promoting back-to-school in earnest near the beginning of July in 2018. As early as July 8 in 2018, many retailers were featuring back-to-school on the front page, and most had back-to-school messaging somewhere in their circular.
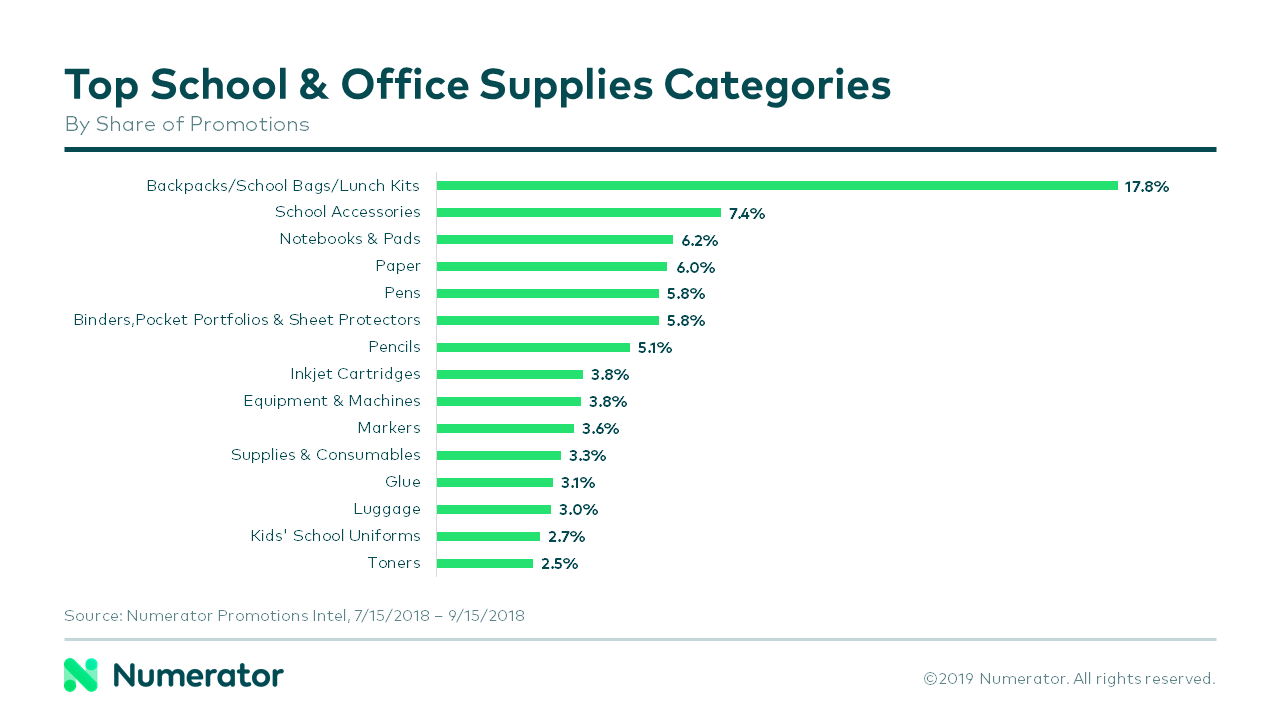
Focusing our analysis on school and office supplies, we found that the top promoted BTS category was backpacks/bags/lunch kits (representing 17.8% of total BTS promotions). With the next closest category (school accessories) coming in at 7.4%, it appears that retailers’ promotional focus was primarily on backpacks in 2018. As one of the more expensive items on the average BTS shopping list, it makes sense that retailers would want to win that purchase with the hopes of winning the entire back-to-school basket in the process.
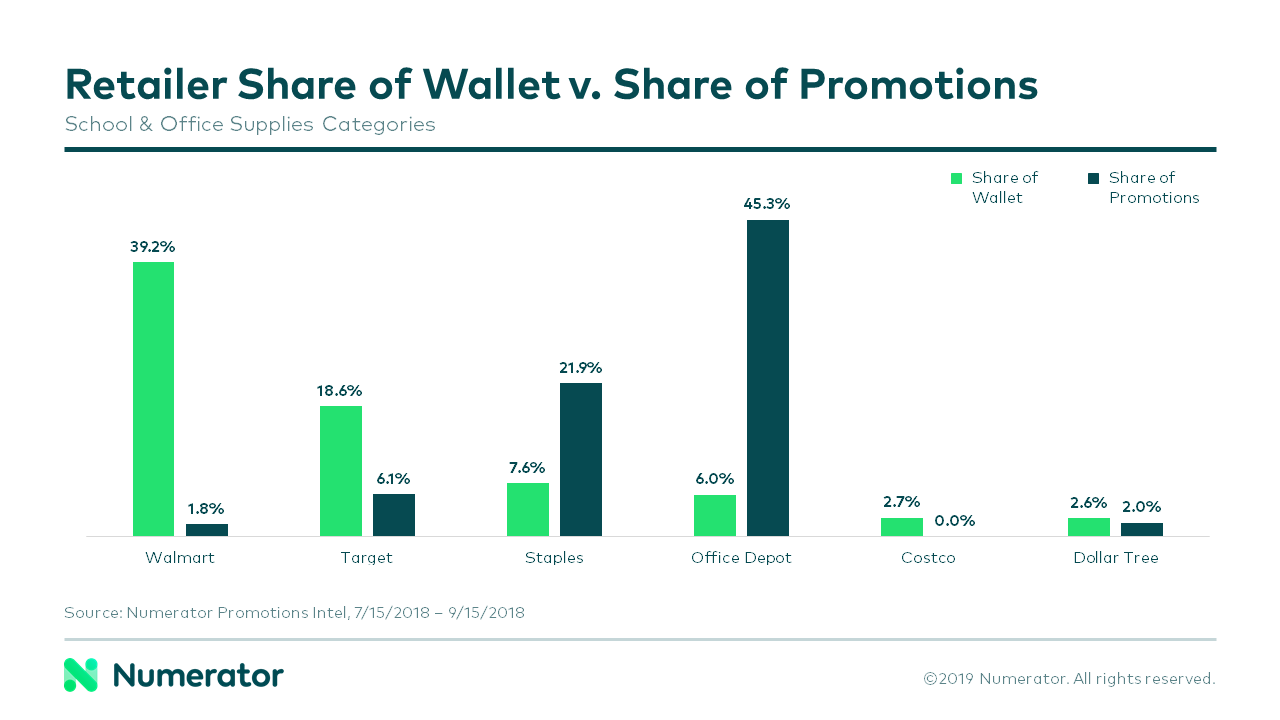
The top promoting retailer (among common stops for back-to-school shopping) by far was Office Depot/Office Max, with 45.3% of promotional share. Staples came in second at 21.9%, and Dollar General a distant third with 10.7%. Interestingly, while Walmart promoted office & school supplies sparingly during the 2018 back-to-school time period, they still earned the highest share of wallet (39.2%) and even increased their share of wallet (SOW) versus 2017. Even more interestingly, despite out-promoting the rest of the pack for office & school supplies during our time period, Office Depot/Office Max and Staples both experienced a decreased SOW between 2017 and 2018.
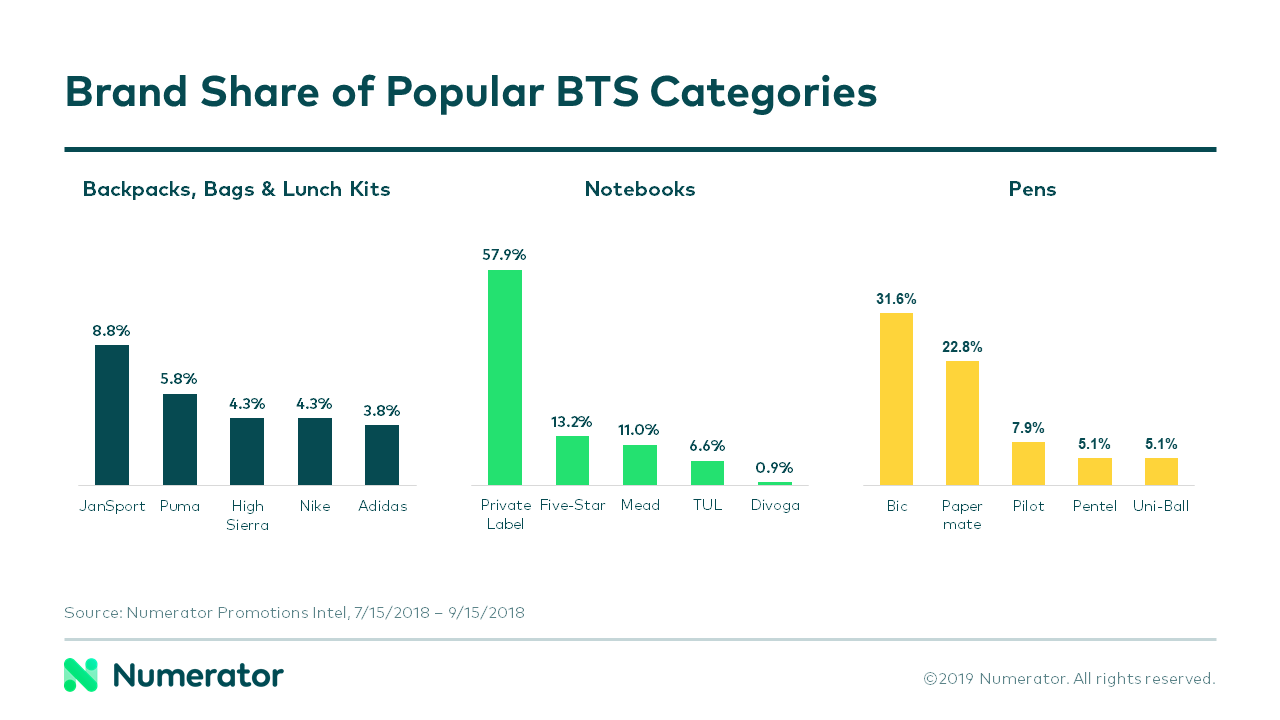
We also reviewed top promoted brands for a few key back-to-school categories. When it comes to backpacks, JanSport led with the most promotional share (8.8% each). When looking at all the promotions on notebooks, it turns out that Private Label brands were most promoted during the back-to-school season (with 57.9% share). And the last category we looked at for brand share was pens – with Bic leading the pack at 31.6% promotional share.
Having a holistic view of seasonal shopping events is vital for better planning and improving performance. At Numerator, we provide comprehensive visibility and deeper insight into the competitive cross-media promotional landscape, as well as psychographic data that can help you better understand your own consumers and category buyers . For more information about an event review of shopper and promotional trends in your category, click here, or reach out to us at hello@numerator.com today!

